
12 KiB
+++ title = "Document panel"
[extra] order = 2 +++
The Document panel is the main content area where the artwork is displayed and edited using tools within the viewport. It's also where the node graph can be overlaid by pressing CtrlSpace. The viewport is for interactive, visual editing of the canvas. The node graph is where you can inspect the underlying structure of the document and edit it in a more technical way if the need arises.
There is one instance of the Document panel per open document file. Each has its own tab labeled with its file name. When a document has unsaved changes, an * is included at the end of the name.
The Document panel is composed of three main areas:
- The top bar runs across the top of the panel and provides controls and view options.
- The shelf is the narrow vertical bar that runs down the left of the panel and lists a selection of tools or nodes.
- The table fills the rest of the panel and contains the viewport and overlaid node graph.
The content of each depends if the viewport or node graph is visible, as described in the two sections below.
Interactive viewport editing
Top bar
While the viewport is visible, the left of the bar provides controls for the active tool and the right provides view options.
Editing modes
Only the default mode is currently implemented. Others will be added in the future and this dropdown is a placeholder for that.
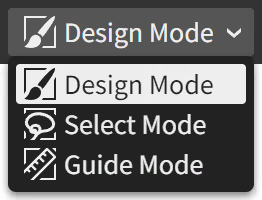 |
The default, Design Mode, is for directly editing the artwork. Once implemented, Select Mode will be where marquee selections are made to constrain the active tool's edits to a masked area of choice. Once implemented, Guide Mode will be for creating guides and constraint systems used for alignment and constraint-based layout. |
Tool options
Provides controls for the active tool. These change with each tool, and are blank for some.

Pictured above is the tool options for the Select tool. It provides options related to its selection behavior and offers useful action buttons for modifying the selected layers with alignment, flipping, and (not-yet-implemented) boolean operations.
Each tool's options are described in the Tools chapter.
Viewport options
Shows options for how the viewport is displayed and interacted with.

| Snapping | Snapping is temporarily unavailable. When the feature is restored, it will behave as described below. When checked (default), drawing and dragging points and layers means they will snap to the alignment points that are visualized as blue overlayed dots/lines located at points of geometric interest within other layers. When unchecked, the selection moves freely. Fine-grained options are available by clicking the overflow button to access its options popover menu: 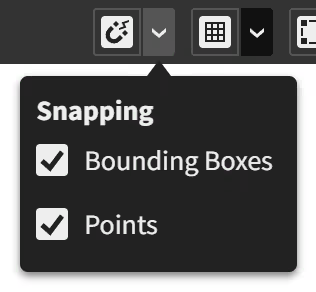
|
| Grid | Not yet implemented. This is a placeholder for upcoming grid alignment and pixel-perfect snapping features. |
| Overlays | When checked (default), overlays are shown. When unchecked, they are hidden. Overlays are the contextual visualizations that appear in blue atop the viewport when using tools. |
| View Mode | Normal (default): The artwork is rendered normally. Outline: The artwork is rendered as a wireframe. Pixels: Not implemented yet. The artwork is rendered as it would appear when exported as a bitmap image at 100% scale regardless of the viewport zoom level. |
| Zoom In | Zooms the viewport in to the next whole increment. |
| Zoom Out | Zooms the viewport out to the next whole increment. |
| Zoom to 100% | Resets the viewport zoom to 100% which matches the canvas and viewport pixel scale 1:1. |
| Viewport Zoom | Indicates the current zoom level of the viewport and allows precise values to be chosen. |
| Viewport Tilt | Hidden except when the viewport is tilted (use the View > Tilt menu action). Indicates the current tilt angle of the viewport and allows precise values to be chosen. |
Shelf
This narrow bar runs vertically down the left side of the Document panel beside the table where the viewport is displayed.
Tool shelf
Located at the top of the shelf area, the tool shelf provides a selection of tools for interactively editing the artwork.
 |
The tool shelf is split into three sections: the general tools (gray icons), vector tools (blue icons), and raster tools (orange icons). General tools are used for assorted editing tasks within the viewport. Vector tools are used for drawing and editing vector shapes, curves, and text. Raster tools are used for drawing and editing raster image content. The grayed out icons are placeholders for upcoming tools. |
Graph view button
Toggles the visibility of the overlaid node graph. It looks like this while closed:

Working colors
The working colors are the two colors used by the active tool.
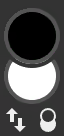 |
The upper circle is the primary color. The lower circle is the secondary color. There are two buttons located underneath: Swap which reverses the current color choices, and Reset which resets the primary color to black and the secondary color to white. |
Various tools provide choices for using the primary and secondary colors as controls in the tool options. For example, many vector tools have Fill and Stroke options that use the current secondary and primary colors, respectively, as defaults:

These options each allow choices of being driven by the primary working color, secondary working color, or a custom color set just for that tool.
Table
The table contains the viewport bounded by rulers and scrollbars along its edges.
Rulers and scrollbars
The rulers, located along the top and left edges within the table, display the size and location of the viewport's visible region in canvas coordinates.
The scrollbars, located along the bottom and right edges within the table, allow scrolling the artwork to show different parts of the canvas in the viewport.
Viewport
The viewport is the view into the canvas. It is where the artwork is displayed and interactively edited using the tools.
Overlaid node graph editing
Opening the overlaid node graph shows the structure of nodes and layers that compose the document artwork. It's a more detailed view of what the Layers and Properties panels show.
Nodes are the entities with left-to-right input connectors.
Layers are the larger entities shown with thumbnails and a bottom-to-top direction of data stacking. Their purpose is to composite sources of graphical data on top of one another in a layer stack. Layers take input from other nodes or layers via a connector on their left side. When that connector is fed by another layer stack, the Layers panel considers it a group because it combines one stack into another parent stack.
Layers and nodes are wired together using links which send data between the outputs of nodes to the inputs of others. You can wire up a node by dragging from the output connector of one node to the input connector of its destination node. But note that forming cyclic graphs, where a loop can be traced along the links of a set of nodes, is not permitted. Graphical data flows into the Output node which then becomes rendered to the document viewport.
Top bar
Provides several controls for the graph and selected node or layer. The options change based on what's selected.
Node/layer controls
When a layer or node is selected, these buttons will show up on the right side of the top bar:

| Make Hidden/ Make Visible |
Toggles the visibility state of the layer or node. This is equivalent to the eye icon button next to each row in the Layers panel. If a node or layer is hidden, it gets bypassed in the data flow. CtrlH (macOS: ⌘H) is a shortcut that can be used in the graph or viewport to hide the selected. |
| Preview/ End Preview |
Temporarily moves the graph output away from the Output node and the graph output is instead provided by the previewed node. While previewing, the node is styled with a dashed, brighter border. Ending the preview returns responsibility back to the Output node. This is a handy feature for viewing part of a graph without needing to disconnect the actual Output node and manually restore it later. Clicking a node or layer while holding Alt is a shortcut for toggling its preview on or off. |
Shelf
This narrow bar runs vertically down the left side of the Document panel beside the table where the graph is displayed.
In the future, icons for the common categories of nodes will be listed down from the top allowing quick access and browsing. For now, this area is empty.
Graph view button
Toggles the visibility of the overlaid node graph. It looks like this while open:

Working colors
Same functionality as when the graph overlay is closed.